Myop Dev Extension
The Myop Chrome Extension has been officially approved by Google and is now available on the Chrome Web Store. Install it for automatic updates, improved stability, and seamless access to all new features.
The Myop Dev Extension is a Chrome browser extension that enables local development and testing of Myop components. It intercepts network requests to Myop's cloud service and serves your local component HTML instead, allowing you to see changes instantly without deploying.
For file watching and automatic rebuilding, use the Myop CLI with myop dev — provides a local dev server with HMR support.
Features
- Instant Tab Override - Override components directly from open Component Editor tabs - no saving or publishing required
- Local Component Override - Serve local HTML content instead of cloud-hosted components
- Dashboard Sync - One-click sync of components from dashboard.myop.dev
- Site Management - Pause interception on specific sites
- SDK Detection - Detect Myop SDK on any page and inspect loaded components
- Element Inspector - Visual element picker for future component creation
- Request Logging - Track all intercepted requests in real-time
- DevTools Panel - Chrome DevTools integration with event tracking and waterfall timeline
Installation
Install the official extension from the Chrome Web Store:
- Visit the Myop Chrome Extension on the Chrome Web Store
- Click Add to Chrome
- The Myop Dev extension icon will appear in your toolbar
Benefits of the Chrome Web Store version:
- Official Google-approved listing
- Automatic updates
- Improved stability and security
- Seamless access to all new features
If you previously installed the extension manually, please follow these steps:
- Delete the manually installed version from your browser (
chrome://extensions/) - Install the official version from the Chrome Web Store (current version: v1.2.1)
Once installed from the Chrome Web Store, you won't need to worry about updating manually anymore.
Quick Start
Syncing Components from Dashboard
The easiest way to get started is by syncing components directly from the Myop Dashboard:
- Navigate to dashboard.myop.dev
- Log in to your account
- Click the floating Myop Dev button that appears in the top-right corner

- The sync panel will open showing all your components
- Use the Search box to filter by name
- Use the Tags and Editors dropdowns to filter further
- Click Override on any component to register it for local development
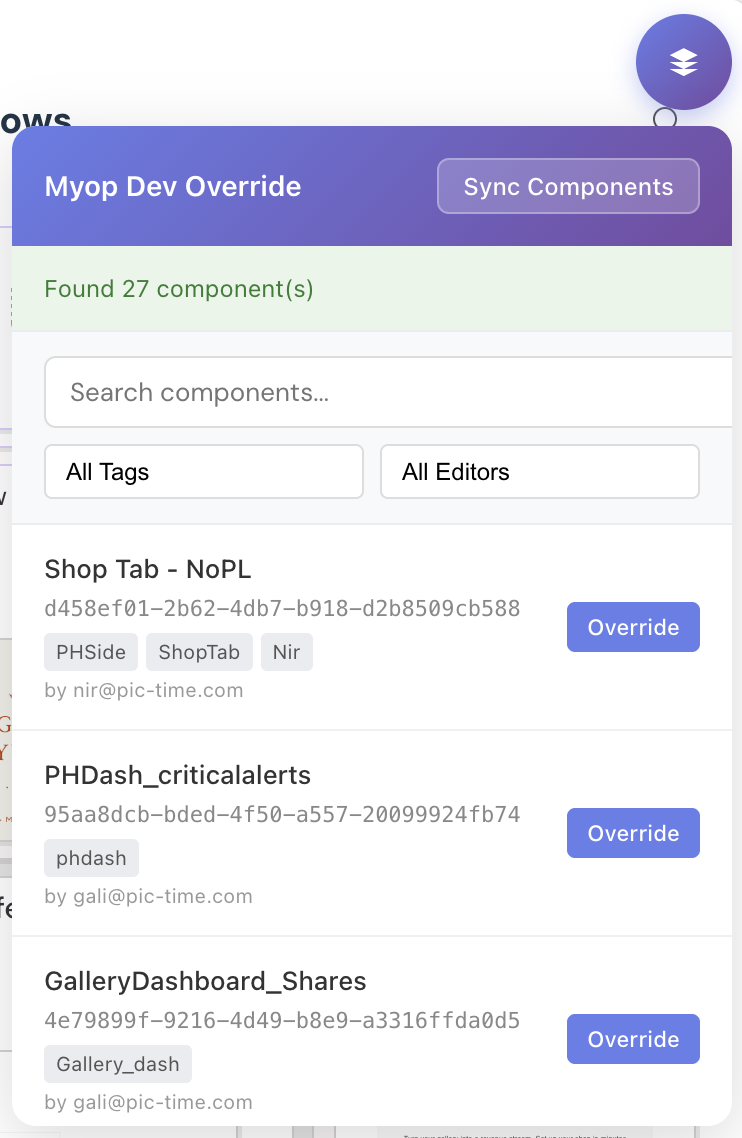
Once synced, the component will be served locally whenever any page requests it from Myop's cloud.
Extension Popup
Click the Myop Dev extension icon in your Chrome toolbar to open the popup interface.
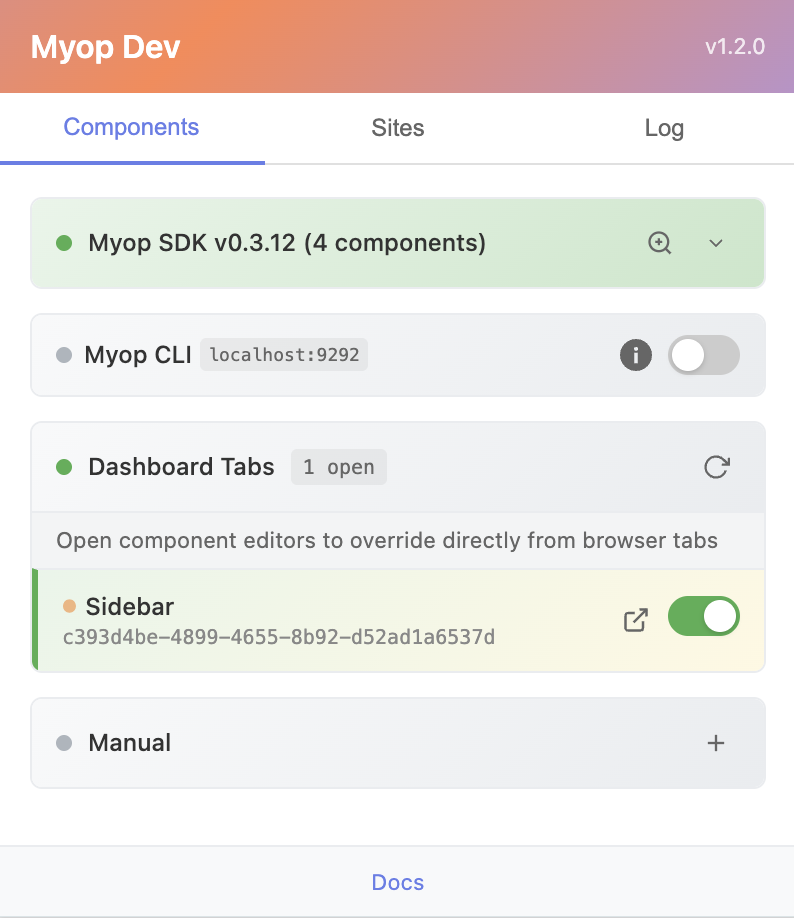
Components Tab
The Components tab organizes local component overrides into collapsible sections:
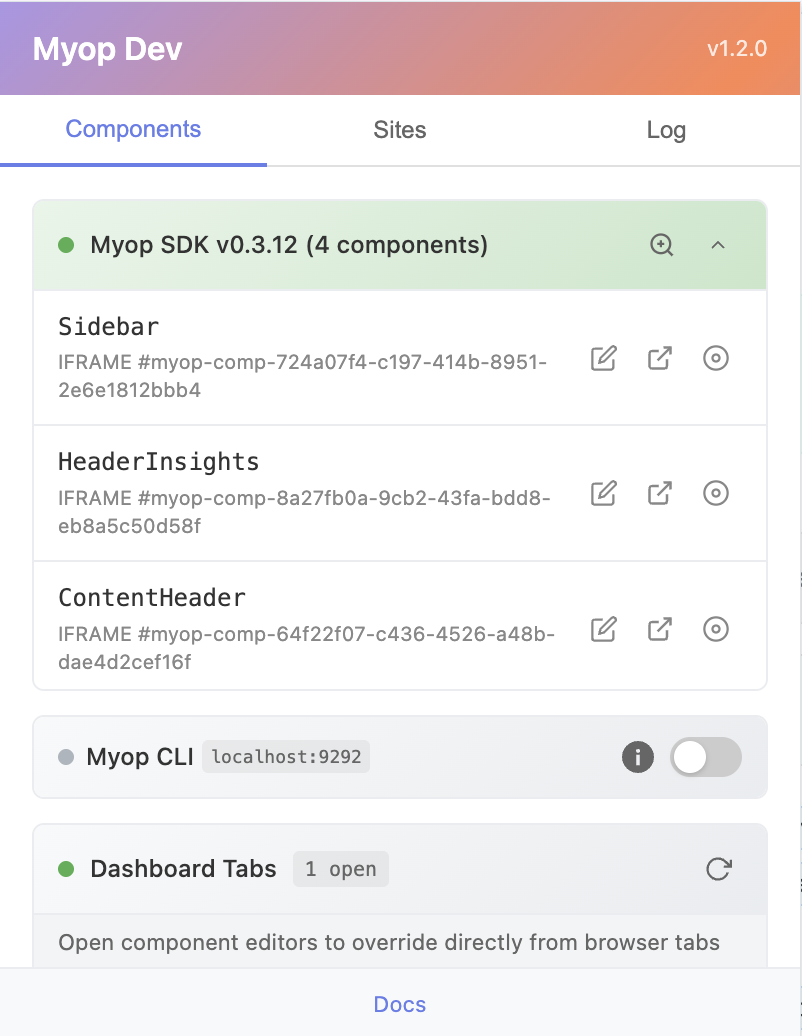
Myop SDK Section
Shows the SDK version detected on the current page and lists all components loaded on that page. Click the expand arrow to see component details. Each component shows:
- Component name and ID
- Focus button (🔍) to highlight the component on the page
- Override button (↗️) to open the component editor in the dashboard
Myop CLI Section
When running the Myop CLI with myop dev, this section shows all components being served from your local development server:
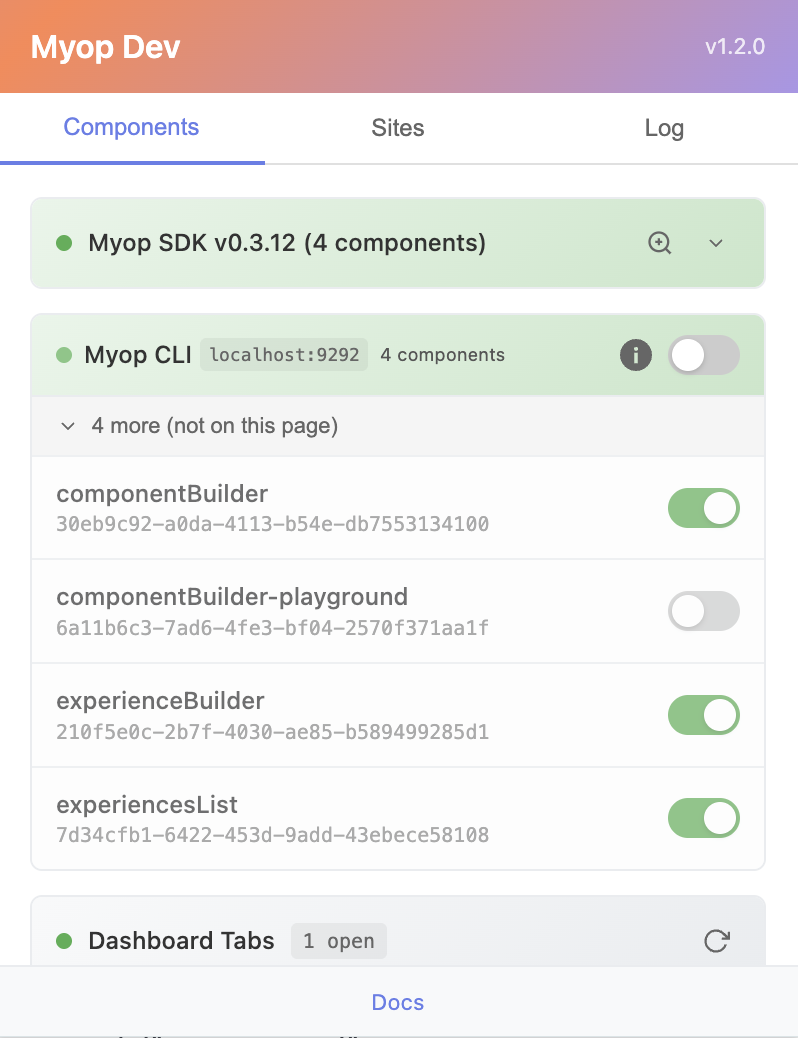
| Element | Description |
|---|---|
| Connection Status | Shows localhost:9292 when connected to CLI |
| Component Count | Number of components available from CLI |
| Toggle Switch | Enable/disable override for each component |
| "not on this page" | Components available but not used on current page |
Dashboard Tabs Section
You can now override components directly from Chrome tabs - no saving or publishing required. Simply open any component in the Myop Component Editor in a Chrome tab (in the same browser window), and the extension will automatically detect its content and let you override that component instantly on any Myop website. This makes testing and iteration much faster.
A powerful feature that lets you override components directly from open dashboard.myop.dev browser tabs:
- Open dashboard.myop.dev in a browser tab
- Navigate to a component's editor
- The extension automatically detects open editors
- Toggle the switch to serve that component locally
| Element | Description |
|---|---|
| Tab Count | Shows number of open dashboard tabs with editors |
| Refresh Button | Manually refresh the list of open tabs |
| Component Name | Name from the dashboard editor |
| Component ID | UUID of the component |
| Open Button (↗️) | Jump to the dashboard tab |
| Toggle Switch | Enable/disable override for this component |
With Dashboard Tabs, you can edit components in the dashboard editor and instantly see changes on any site. No need to sync or copy HTML manually!
Manual Section
Add components manually by clicking the + button:
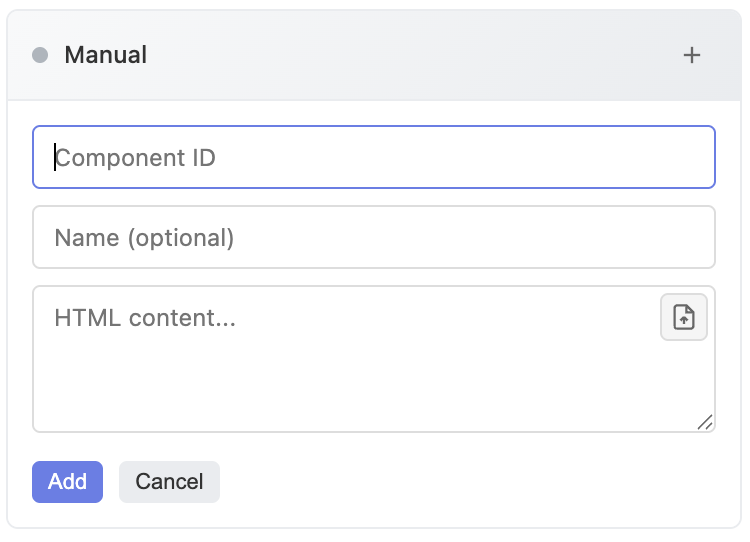
| Field | Description |
|---|---|
| Component ID | The UUID of the component to override |
| Name (optional) | Friendly display name |
| HTML content | The HTML to serve, or click the upload icon to load from file |
Sites Tab
Manage which sites the extension operates on:
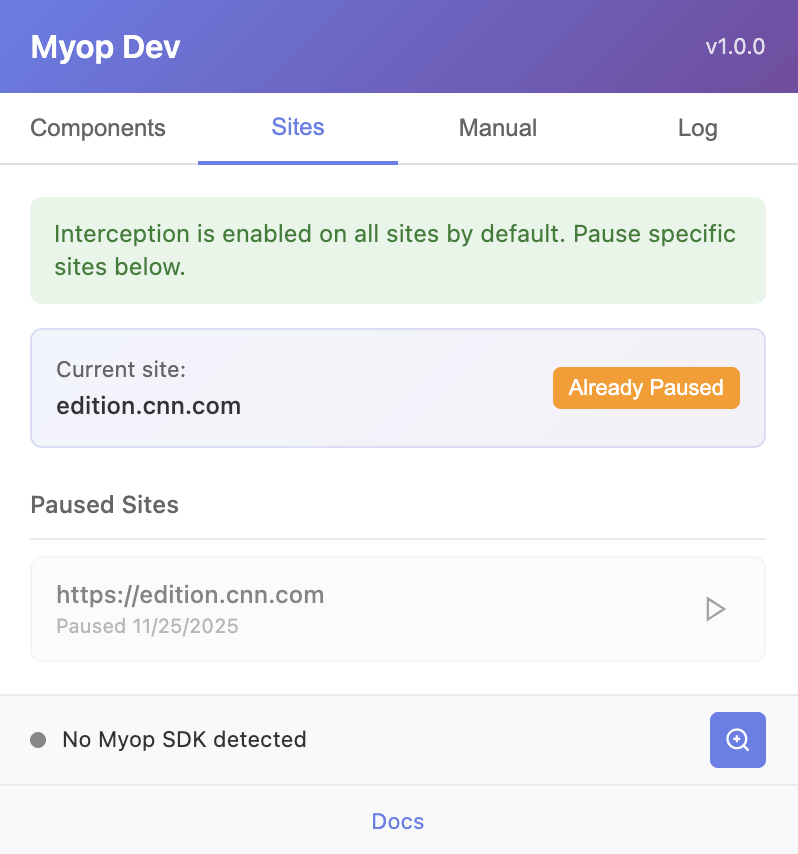
By default, the extension intercepts requests on all sites. Use this tab to pause interception on specific sites:
- The current site is shown at the top
- Click "Pause on this site" to disable interception
- Paused sites appear in the list below
- Click the play button to resume interception on a paused site
When viewing a paused site, the extension badge shows "||" in orange to indicate interception is disabled.
Log Tab
View a real-time log of all intercepted requests:
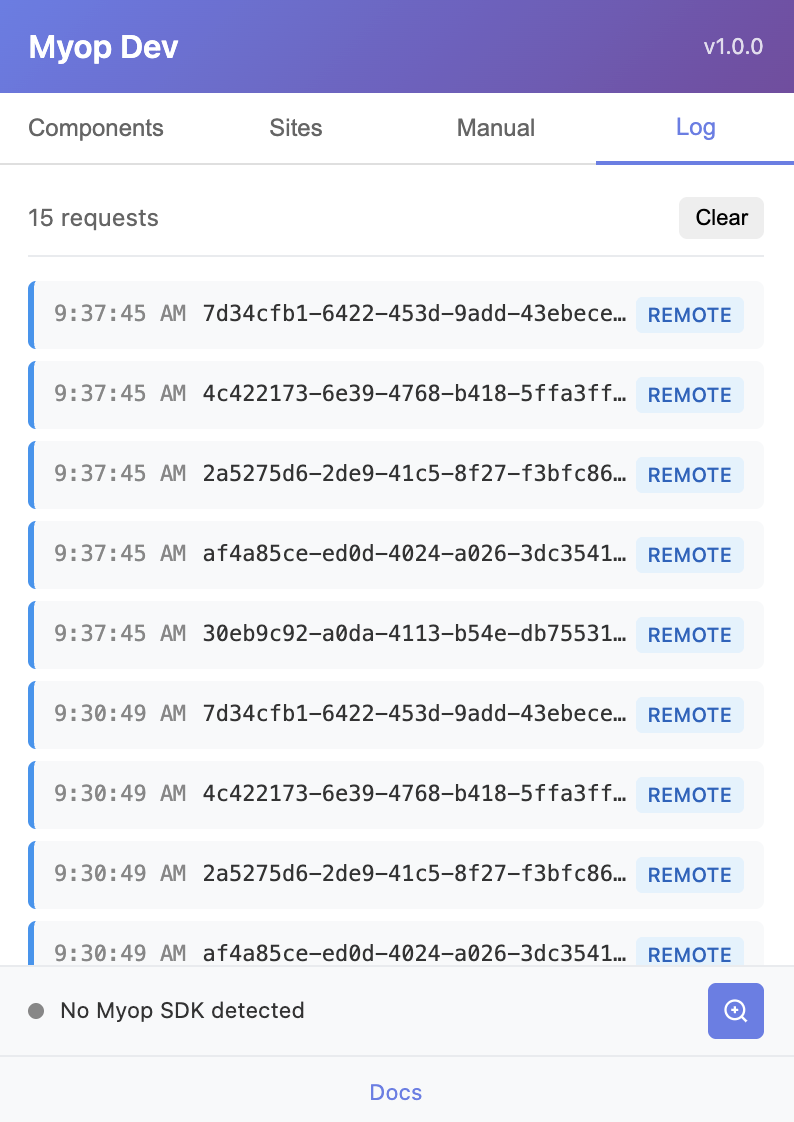
Each entry shows:
- Timestamp - When the request occurred
- Component ID - Which component was requested
- LOCAL / REMOTE - Whether local content was served or the request passed through
SDK Detection
The extension automatically detects when a page is running the Myop SDK. The status bar at the bottom of the popup shows:
| Status | Meaning |
|---|---|
| 🟢 Myop SDK v1.x.x | SDK detected with version number |
| ⚫ No Myop SDK detected | Page is not using Myop |
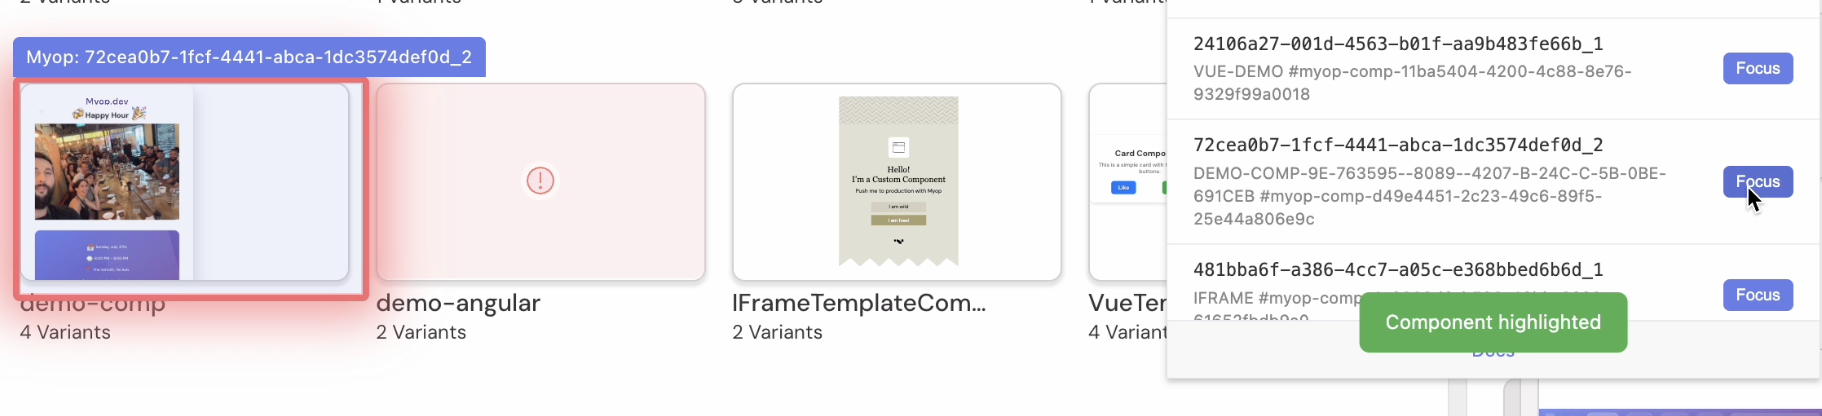
Viewing Page Components
When the SDK is detected and components are loaded on the page:
- The status shows the component count: "Myop SDK v1.0.0 (3 components)"
- Click the expand arrow to see all components
- Each component shows its ID and element type
- Click "Focus" to highlight the component on the page
The focused component will be highlighted with a pulsing purple border for 3 seconds, making it easy to locate on the page.
Element Inspector
The extension includes a visual element inspector for exploring page structure:
- Click the magnifying glass button (🔍) in the SDK status bar
- The popup closes and inspect mode activates
- Your cursor changes to a crosshair
- Hover over any element to see it highlighted with its tag name
Inspector Controls
| Action | Result |
|---|---|
| Hover | Highlights element with purple border and shows tag info |
| Click | Selects the element (logs innerHTML to console) |
| ESC | Exits inspect mode without selecting |
The "Create Myop component" feature from selected elements is coming in a future release!
Badge Indicator
While inspect mode is active, the extension badge shows "🔍" with a purple background.
DevTools Panel
The extension adds a dedicated "Myop" tab to Chrome DevTools, providing powerful debugging and monitoring capabilities for your Myop components.
Opening the DevTools Panel
- Open Chrome DevTools (
F12orCmd+Option+Ion Mac) - Navigate to the "Myop" tab in the DevTools panel tabs
- Click "Start Recording" to begin capturing events
Event Tracking
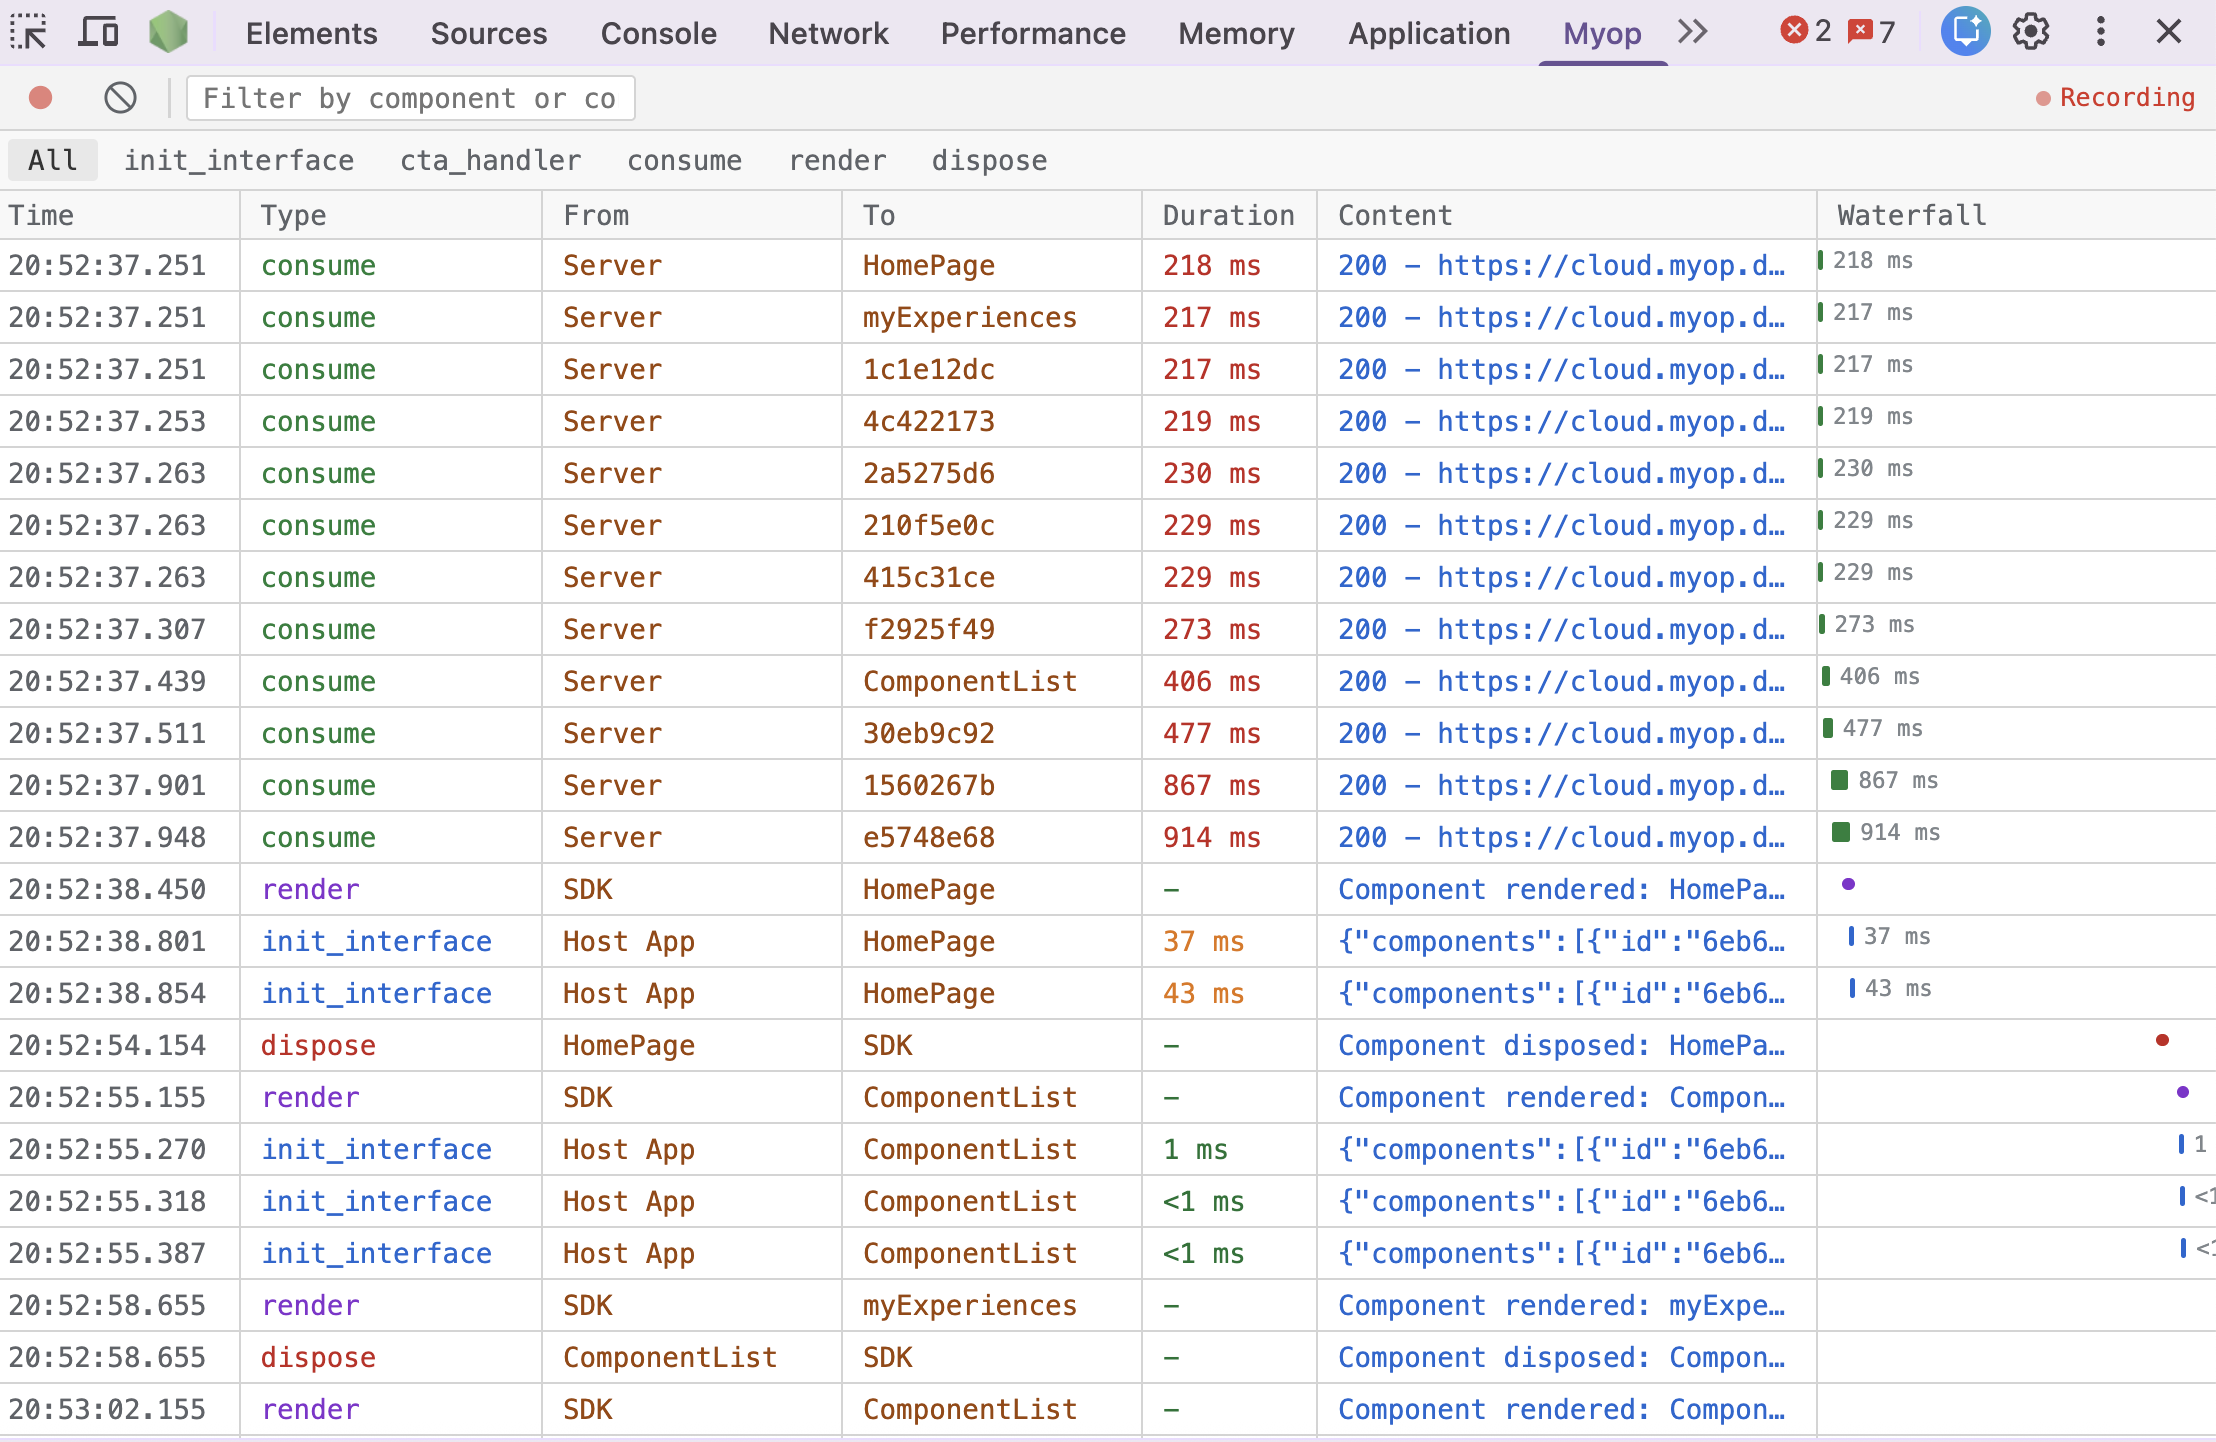
The DevTools panel captures and displays all Myop-related events in a table format similar to Chrome's Network tab:
| Column | Description |
|---|---|
| Time | Timestamp when the event occurred |
| Type | Event type (init_interface, cta_handler, consume, render, dispose) |
| From | Source of the event (Host App, Server, SDK, Component) |
| To | Destination of the event |
| Duration | Time taken to process (color-coded: green < 16ms, yellow < 100ms, red > 100ms) |
| Content | Preview of the event payload |
| Waterfall | Visual timeline bar showing when the event occurred relative to others |
Event Types
| Type | Color | Description |
|---|---|---|
| init_interface | 🔵 Blue | Component initialization calls from host to component |
| cta_handler | 🟠 Orange | Call-to-action events from component to host |
| consume | 🟢 Green | API calls to /consume endpoint (server or extension intercepted) |
| render | 🟣 Purple | Component added to the page |
| dispose | 🔴 Red | Component removed from the page |
Waterfall Timeline
The waterfall column provides a visual representation of event timing, similar to Chrome's Network tab:
- Bar position shows when the event started relative to the first recorded event
- Bar width represents the duration of the event
- Instant events (like render/dispose) appear as small dots
- Events with duration show the time label next to the bar
Recording Controls
| Control | Description |
|---|---|
| Record Button (⏺️) | Toggle recording on/off. Red when recording. |
| Clear Button (🚫) | Clear all recorded events |
| Filter Input | Search events by component name or content |
| Filter Tabs | Filter by event type (All, init_interface, cta_handler, consume, render, dispose) |
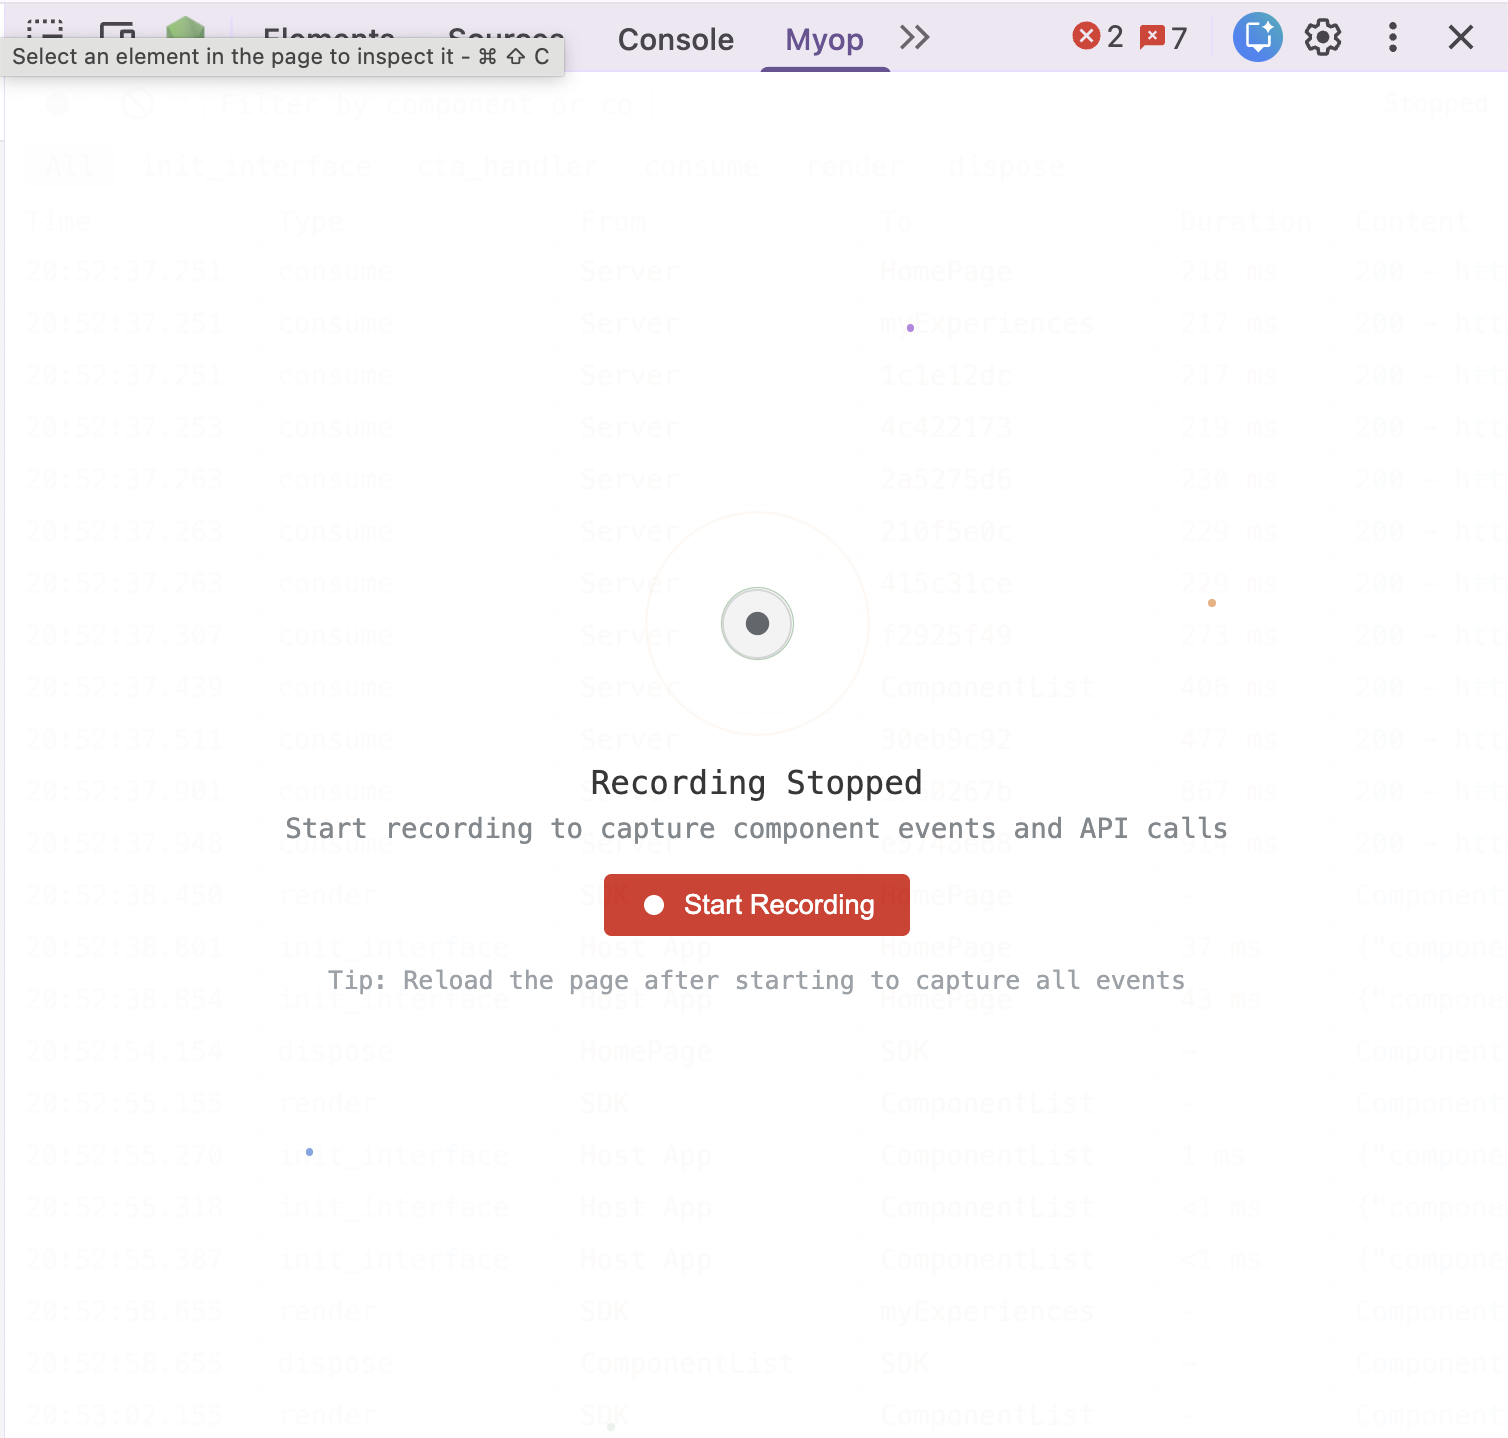
Recording State
- Recording state persists across page reloads - if you start recording and refresh the page, recording continues automatically
- When recording is stopped, an overlay appears with a "Start Recording" button
- The status indicator in the toolbar shows "Recording" or "Stopped"
To capture all component events from page load, start recording first, then reload the page. This ensures you capture initial consume API calls and component renders.
Event Details
Click any row to view the full event payload in the detail panel below:
- Payload Tab shows the complete JSON data
- Copy Button copies the JSON to clipboard
- Click the ✕ button or click another row to close
Theme Support
The DevTools panel automatically adapts to your system theme preference:
- Dark theme when your system/browser is in dark mode
- Light theme when your system/browser is in light mode
Badge States
The extension icon badge indicates the current state:
| Badge | Color | Meaning |
|---|---|---|
| Number (e.g., "3") | 🟢 Green | Number of enabled local components |
| "||" | 🟠 Orange | Interception paused on current site |
| "🔍" | 🟣 Purple | Element inspector is active |
| (empty) | - | Extension active, no local components |
How It Works
Request Interception
When a page makes a request to Myop's consume endpoint:
https://cloud.myop.dev/consume?id={componentId}
The extension checks if that component ID is registered locally:
- If registered & enabled → Returns local HTML content
- If not registered or disabled → Request passes through to cloud
- If site is paused → All requests pass through to cloud
Response Format
The extension generates a response matching Myop's API format:
{
  "item": {
    "name": "component-id",
    "id": "component-id",
    "consume_variant": [
      {
        "id": "dev-1234567890-abc123",
        "name": "dev version (extension)",
        "loader": {
          "type": "HTMLLoader",
          "shadowRootMode": "localFrame",
          "HTML": "<your-local-html-content>"
        }
      }
    ]
  }
}
Best Practices
Development Workflow
- Sync from dashboard to get the current production HTML
- Edit locally using your preferred code editor
- Update in extension by editing the component or re-syncing
- Test on any site that uses the component
- Deploy when ready through the Myop Dashboard
Tips
For rapid iteration, keep your HTML in a local file and use the "Load from File" button to quickly update the component content.
You can have multiple components registered simultaneously. Use the toggle switches to quickly enable/disable specific overrides.
Remember that paused sites won't receive local content. Check the badge indicator if components aren't loading as expected.
Troubleshooting
Component Not Loading Locally
- Check that the component is enabled (toggle is green)
- Verify the site is not paused (no orange "||" badge)
- Confirm the Component ID matches exactly
- Check the Log tab to see if requests are being intercepted
Sync Not Working
- Ensure you're logged into dashboard.myop.dev
- Refresh the dashboard page and try again
- Check the browser console for error messages
SDK Not Detected
The SDK detection requires the page to have window.myop.rootSDK.version available. This is set by the Myop SDK after initialization. If you're testing on a page where Myop is still loading, wait a moment and reopen the popup.
Keyboard Shortcuts
| Shortcut | Action |
|---|---|
| ESC | Exit element inspector mode |
Privacy & Security
- The extension only intercepts requests to
*.myop.dev/consume*endpoints - Authentication tokens are read from the dashboard page only (never stored)
- All local component data is stored in Chrome's local storage
- No data is sent to external servers (except normal Myop API calls)